 Note:
Note:The Intel® IDB supports debugging of message passing interface (MPI) applications launched by
This chapter contains the following sections:
The biggest challenge of debugging massively parallel applications is coping with large quantities of output from debuggers controlling the parallel application's processes. Intel Debugger helps you do this by condensing (aggregating) similar output into groups. Aggregation is performed by using the following two strategies:
Identical output messages are condensed into a single output message. When a condensed message is displayed, it is prefixed with a range of user process IDs (not necessarily consecutive) to which this output applies. All processes with the same output are aggregated into a single and final output message, for example:
[0-41] Intel(R) Debugger for Itanium®-based applications, Version XX
|
Process range
Outputs that have different hexadecimal digits, but are otherwise identical, are condensed by aggregating the differing digits into a range, for example:
[0-41]>2 0x120006d6c in feedback(myid=[0;41],np=42,name=0x11fffe018="mytest") "mytest.c":41
| |
Process range Value range
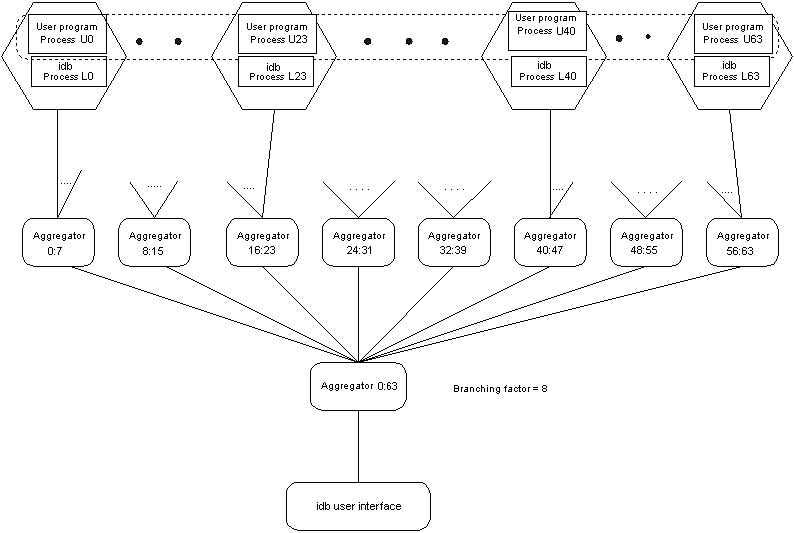
Another challenge of debugging massively parallel applications is controlling all processes or subsets of the parallel application's processes from the debugger in a consistent manner. The debugger allows you to control all or a subset of your processes through a single user interface. At the startup of a parallel debugging session, Intel IDB does the following:

The root debugger is responsible for starting your parallel application and serves as your user interface. The aggregators perform output consolidation as described previously. The leaf debuggers control and query your application processes.
The branching factor is the factor used to build the n-nary tree and determine the number of aggregators in the tree. For example, for 16 processes:
You can set the value of the $parallel_branchingfactor variable from its default value of 8 to a value equal to or greater than 2 in the Intel IDB initialization file (.idbrcidbinit.idb, and so on).
When you delete $parallel_branchingfactor from the Intel IDB initialization file, the branching factor used in the startup mechanism is the default value.
Aggregator delay specifies the time that aggregators wait before they aggregate and send messages down to the next level when not all of the expected messages have been received.
You can change the value of the $parallel_aggregatordelay variable from its default value of 3000 milliseconds in the Intel IDB initialization file (.idbrcidbinit.idb, etc.). See Parallel Debugging Tips for more information.
When you delete $parallel_aggregatordelay from the Intel IDB initialization file, the aggregator delay used in the startup mechanism is the default value.
 Note:
Note:You can only change the values that are set for $parallel_branchingfactor and $parallel_aggregatordelay at startup, in the .idbrcidbinit.idb file. After the program has started up, you cannot change these values.
 Note:
Note:The Intel® Debugger uses rsh to create the leaf debugger and aggregator processes in the tree structure. Make sure that every node in your cluster has rsh privilege to all other cluster nodes for proper setup of the tree structure.